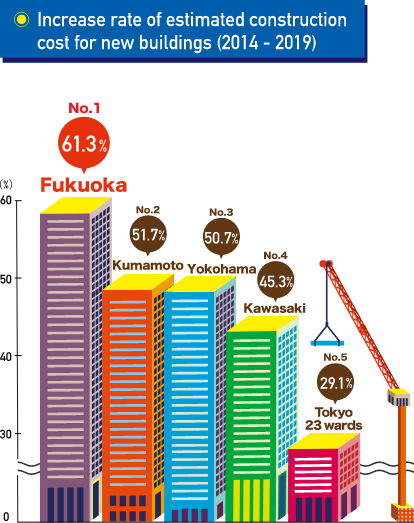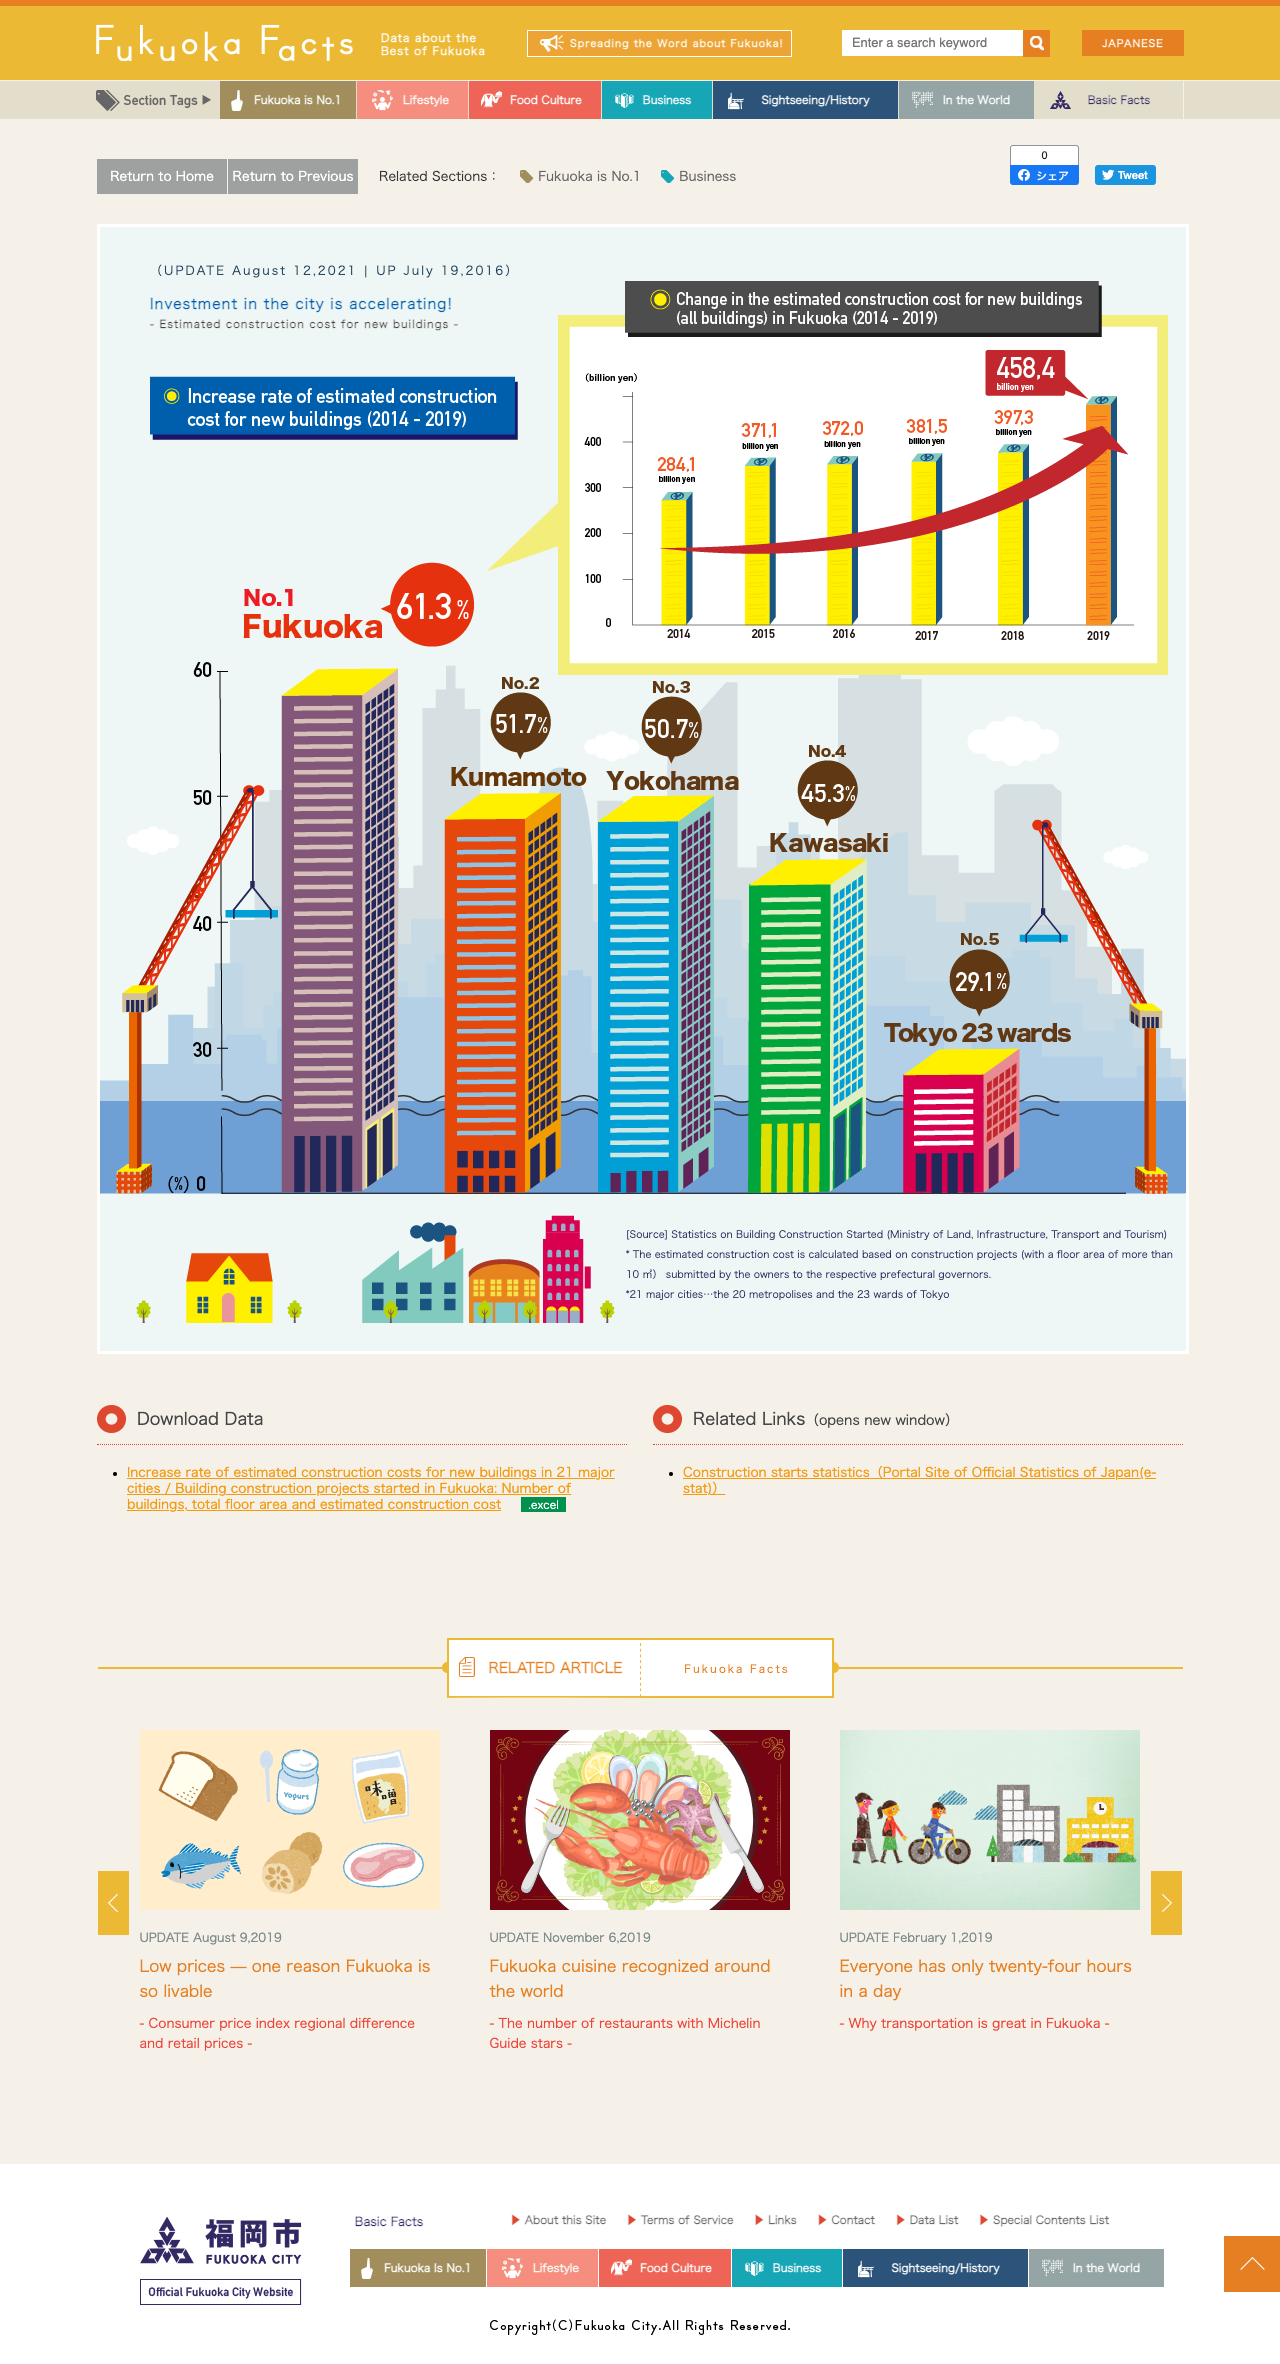


[Source] Statistics on Building Construction Started (Ministry of Land, Infrastructure, Transport and Tourism)
* The estimated construction cost is calculated based on construction projects (with a floor area of more than
10 ㎡) submitted by the owners to the respective prefectural governors.
*21 major cities…the 20 metropolises and the 23 wards of Tokyo